As many in the SA Income Investing forum know, I maintain several research-based, dividend-growth [DG] portfolio models in an effort to identify subsets of the DG universe that outperform, and I provide monthly performance updates. These updates include both absolute total return and the M2 measure, an adjusted return that factors in the portfolio's volatility relative to its benchmark, the S&P 500 Index (SPY). Dividend investors typically expect their holdings to underperform in absolute terms during bull markets and to decline less in bear markets, given the generally lower beta of dividend-stock portfolios.
Recent research has found that over the long run, lower volatility stocks outperformed higher volatility stocks in absolute total return. This result flies in the face of the Efficient Market Hypothesis [EMH] and Modern Portfolio Theory [MPT], which respectively assert that investors cannot consistently achieve excess returns and to obtain higher returns, investors need to take higher risk, as measured by volatility. This series of articles reviews several research studies, covering portfolio construction methods, performance results, and potential explanations for the "low volatility anomaly".
Portfolio Construction
A low-volatility portfolio can be constructed in a couple of ways:
- A mean-variance optimized approach [Markowitz] considers the correlations between portfolio stocks to determine the ones to hold and the weightings to create the portfolio with the lowest variance. One concern is that this method can lead to serious overweighting of a particular stock or sector, depending on recent performance.
- Alternatively, a portfolio of low-volatility stocks can be created by ranking stocks by volatility and choosing the less volatile stocks. This method is much easier for an investor to understand and create, and sector and stock weighting decisions can be independently determined. Blitz and Vliet (2007) showed that volatility correlated with beta, so the readily available beta metric can be used as a proxy for volatility. Blitz and Vliet (2011) also concluded that a rankings-based approach was just as effective at reducing volatility as the mean-variance optimized method; another reason to pursue this option.
EMH supports stock weightings based on market-cap. The low-volatility research showed that weightings based on inverse volatility or inverse beta were superior. In this scheme, a lower beta stock receives a higher weighting. This approach also has the effect of lowering the portfolio beta even more versus market-cap based or equal weighting systems.
The S&P research created and tracked three low-volatility portfolios, rebalanced quarterly, for each level of market capitalization (small, midcap, large):
- Base Case: A mean-variance optimized portfolio with no constraints.
- Constrained Case: A mean-variance optimized portfolio with a 5% maximum stock weighting, and sector weightings between 50% to 150% of the benchmark's sector weight.
- Rankings-Based: Stocks were divided into quintiles based on the standard deviation of the trailing 252 trading days' price changes. Stocks from the lowest quintile were selected and weighted based on the inverse of their standard deviation.
(click to enlarge)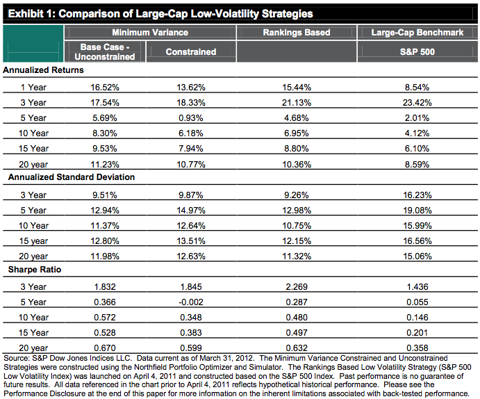
Low-Volatility Portfolios Outperformed
As observed in Exhibit #1 above, all of the low-volatility portfolios had higher absolute returns and relative returns, as measured by the Sharpe ratio, for the 10-year to 20-year periods. The rankings-based portfolio's relative performance was the highest for all years and with one exception, so was its absolute performance. These portfolios delivered strong returns with much lower volatility than the market-cap weighted S&P benchmark. The S&P report showed similar results for the Mid-Cap and Small-Cap low-volatility portfolios.
(click to enlarge)
Graph Source: Baker, Bradley, and Wurgler (2011)
Additional research supports these findings. A sizable difference was found between the performance of the most volatile [top] quintile and the other four lower quintiles. Baker, Bradley, and Wurgler (2011) sorted stocks into five quintiles, both by beta and by volatility, and the top quintile clearly underperformed. Figure #1 above from their research paper shows the value of $1 invested in each volatility quintile in 1968, tracked through 2008. The portfolios were rebalanced at the end of each month. Similar results occurred for the beta-ranked quintiles. I'm sure that the high-beta quintile required more rebalancing and therefore suffered from transaction costs. The gap between this quintile and the others is quite large though, so even allowing for these costs, it clearly underperformed.
(click to enlarge)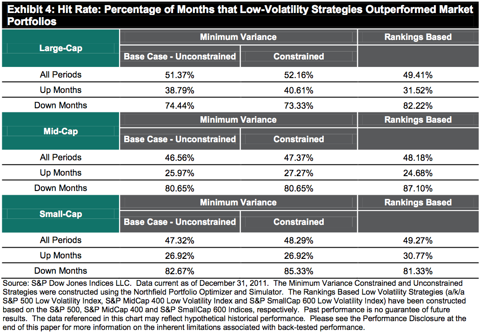
Asymmetric Payoff
The S&P study also tracked the number of months that the low-volatility portfolios beat the benchmark return, broken out by up and down months. As seen in Exhibit #4, on average, these portfolios beat their respective benchmarks about half of the time. The distribution was asymmetric though, as they outperformed 80% of the time during down months, and only around 30% of the time in up months. This supports the usual expectation of dividend stock investors. Since low-volatility stocks outperformed the benchmark overall, this means that while low-volatility stocks lagged in bull markets, they more than made up for this during bear markets.
(click to enlarge)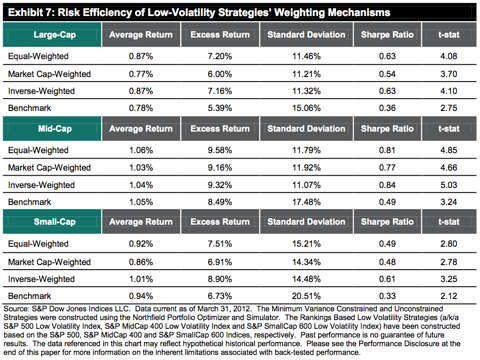
Other Notes of Interest
- Systematic Risk: The S&P study found that of the three low-volatility portfolio strategies, the rankings-based methodology generated the lowest level of systematic risk. Systematic risk, by definition, cannot be diversified away, so a lower level is favorable.
- Weighting Performance: The S&P study evaluated the Sharpe ratios for market-cap, equally weighted, and inverse volatility-weighted portfolios. As seen in Exhibit #7, all of these methodologies delivered higher risk-adjusted returns than their respective benchmarks, and the inverse-weighted approach had the highest Sharpe and lowest volatility in each capitalization group.
(click to enlarge)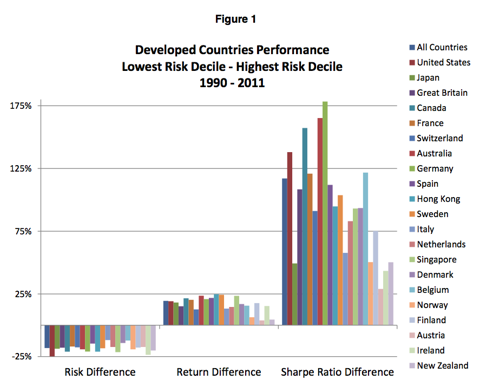
Graph Source: Baker and Haugen (2012)
A Worldwide Anomaly
A research study by Baker and Haugen (2012) supports and expands on the S&P research findings. They found the low-volatility outperformance anomaly to be persistent, "existing now and as far back in time as we can see." Their analysis of 33 developed and emerging markets [Figure #1 above] showed that low-volatility stocks outperformed over a 22-year period (1990-2011) in each of these markets. This study ranked stocks and grouped them into deciles. The graph above compares the lowest-volatility decile stocks to the highest-volatility decile.
Figure #2 below shows the annual risk versus reward for each of these deciles for all countries together. There are clear clusters for the lowest risk and highest risk groups. On average the lowest-volatility decile appears to have delivered a 10% return with 15% volatility, while the highest-volatility decile had a -10% average return with 30% volatility.
(click to enlarge)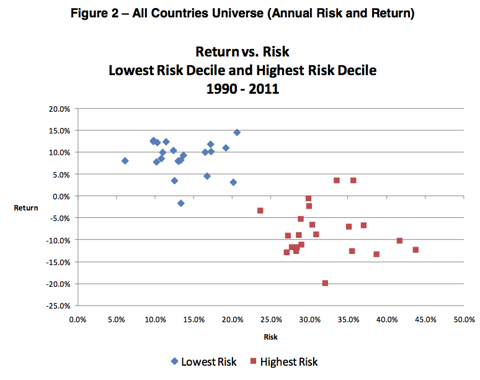
Graph Source: Baker and Haugen (2012)
Summary
Income investors often cite lower volatility as a benefit of a dividend investment strategy. They also understand that during bull markets, their stocks may underperform relative to the overall market, but total return is often not the primary focus. The research presented shows that low-volatility stocks have historically outperformed higher-volatility stocks and market indices over longer periods of time in absolute return. This anomaly appears to exist across all capitalizations and in markets worldwide. By sticking to lower-volatility, dividend-growth stocks and being patient, income investors may be able to not only enjoy their dividends and the smoother ride, but also achieve higher total return in the long-term. That is something to celebrate, assuming the anomaly continues!
Next Steps
Being the curious type, I wondered why the low-volatility anomaly exists and why the market doesn't take notice of this research and arbitrage away these excess returns. The second article in this series will address these questions.
Finally, the third article will highlight a recently created low-beta, high-dividend growth rate [DGR] portfolio based on the rankings and inverse-volatility methodologies and research on high DGR as the primary driver of returns. This portfolio includes stocks such as: Darden Restaurants (DRI), Lorillard (LO), Steris Corp (STE), Sempra Energy (SRE), and Sunoco Logistics Partners (SXL). Unlike my other DG portfolios, this one is weighted using inverse beta, both to determine sector weightings and for the individual holdings within each sector. While some holdings overlap with the other DG portfolios, I was pleased to see many new names, providing more stocks to consider for my personal portfolio. Stay tuned for more on low-volatility portfolios!
Disclosure: I am long LO, SRE. I wrote this article myself, and it expresses my own opinions. I am not receiving compensation for it (other than from Seeking Alpha). I have no business relationship with any company whose stock is mentioned in this article.
harden nor easter nor easter ted nugent veep los angeles kings earth day
No comments:
Post a Comment
Note: Only a member of this blog may post a comment.